
Tableau’s “Undocumented” API Made Easy with Python
After returning from this year’s Tableau Conference and all the great sessions on Tableau’s APIs, I couldn’t wait to dive into the content the devs made available. I have been collecting ideas for automated Tableau Server tools for a while now and TC16 ignited the passion in me to put some of them into action.
I started by exploring the REST API with Python and quickly realized that there was a gap between what I wanted to build and the functionality that the API offered. While many Server actions can be scripted, simple things like modifying the schedule attached to an Extract refresh isn’t possible. Why Tableau? You’ll let me change the schedule for a Subscription, so why not an Extract?
The answer is probably that the devs are super busy and they just haven’t gotten around to it. Hopefully this and other Extract functionality (like triggering Extract refreshes) is just a release or two away.
But what should I do in the mean time? I can’t just give up. This is a core element of my app. After a quick post to the Global Tableau Developers Group, I found a tiny light at the end of the tunnel in the form of Tableau’s “Undocumented” API.
What is the “Undocumented API”?
You’re probably not familiar with the Undocumented API by name but if you’ve ever used Tableau Server, you’ve used it. Put simply, the Undocumented API (hereafter referred to by its real name: the Vizportal API) is the technology that enables Tableau Server’s Web Client. Any time you interact with Tableau Server, your browser is issuing calls via the Vizportal API to execute the commands you choose. Using tools like Fiddler (or by inspecting the page with Chrome or Safari) you can see the calls that your browser is making to the Vizportal API.
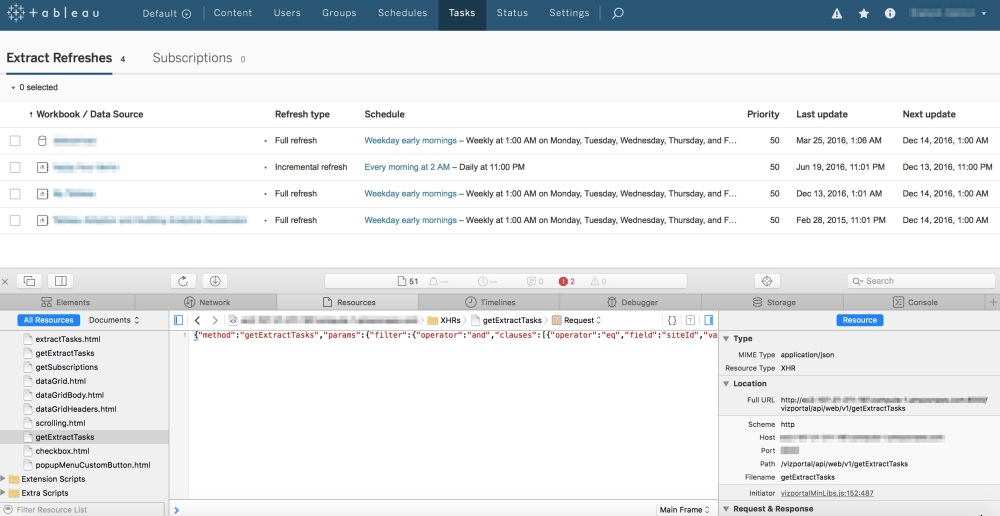
By inspecting the page, we can see there is a call to Vizportal to “getExtractTasks”
This is Amazing! How Come I Never Knew this Existed?
From this we can clearly see that there are API methods for lots of tasks that are not part of the REST API. By leaving the inspector window open and clicking around Server, you can see exactly what calls are used to control each function. Amazing! How come I never knew this existed?
This is why the Vizportal API is known as the Undocumented API. While it’s technically possible to make these same calls from your own code, it’s not officially supported by Tableau. Tableau could disable or change these methods at any time, without notice so if you’re going to use this consider yourself warned.
How To Connect to the Vizportal API using Python
Even though it’s not supported or officially documented, there is some material online that discusses how you can connect to Vizportal. The team at Tableau that runs their internal server has a post that describes one method but it stops just short of providing the code. I’ll present a method using Python (version 2.7) but this could be done with Javascript or any other language the supports HTTP requests and RSA encryption. To log into the Vizportal API we’ll need to perform the following steps:
- Generate a Public Key that we can use to encrypt our password that will be used for the login
- Encrypt the user’s password with RSA PKCS1 encryption
- Login to Vizportal and retain the workgroup_session_id and XSRF-TOKEN so we can submit other calls to Vizportal
Before I go any further I should point out that this is not a back door into Tableau Server. We are still authenticating with a credentialed user and as such, the requests we make will honor the permissions of the user that we’re logging in with. If you’re unable to successfully execute this, check that you’re using a licensed user account with permission to execute the calls you’re making.
Generating the Public Key
The first step we need to do is to generate a public key and capture the modulus and exponent so we can encrypt our password:
import os
import sys
import requests
import json

tab_server_url = "http://your_tableau_server_url"

def _encode_for_display(text):
     return text.encode('ascii', errors="backslashreplace").decode('utf-8')

# Establish a session so we can retain the cookies
session = requests.Session()

def generatePublicKey():
      payload = "{\"method\":\"generatePublicKey\",\"params\":{}}"
      endpoint = "generatePublicKey"
      url = tab_server_url + "/vizportal/api/web/v1/"+endpoint
      headers = {
      'content-type': "application/json;charset=UTF-8",
      'accept': "application/json, text/plain, */*",
      'cache-control': "no-cache"
      }
      response = session.post(url, data=payload, headers=headers)
      response_text = json.loads(_encode_for_display(response.text))
      response_values = {"keyId":response_text["result"]["keyId"], "n":response_text["result"]["key"]["n"],"e":response_text["result"]["key"]["e"]}
      return response_values
This function will return a dictionary with 3 key/value pairs that we can use for the next step.
- The keyId
- The modulus “n”
- The exponent “e”
Put this into practice like this:
 # Generate a pubilc key that will be used to encrypt the user's password
 public_key = generatePublicKey()
 pk = public_key["keyId"]
Encrypting the Password
This was the hardest part of the entire process as I couldn’t find any good examples of how to do this with Python. After spending hours looking for a solution, I reached out to Zen Master Tamás Földi who graciously agreed to help me. Here’s the code he shared:
# You'll need to install the following modules
# I used PyCrypto which can be installed manually or using "pip install pycrypto"
import binascii
import Crypto
from Crypto.PublicKey import RSA
from Crypto.Cipher import PKCS1_v1_5
from base64 import b64decode

# Encrypt with RSA public key (it's important to use PKCS11)
def assymmetric_encrypt(val, public_key):
     modulusDecoded = long(public_key["n"], 16)
     exponentDecoded = long(public_key["e"], 16)
     keyPub = RSA.construct((modulusDecoded, exponentDecoded))
     # Generate a cypher using the PKCS1.5 standard
     cipher = PKCS1_v1_5.new(keyPub)
     return cipher.encrypt(val)
The objective here is to supply your password as the first argument and then input the key retrieved from the previous step as the second argument. The output will be an encrypted string that we will use to log in.
# Encrypt the password used to login
encryptedPassword = assymmetric_encrypt(your_password,public_key)
Now that we have the encrypted password, we’re ready to log in.
Logging into Vizportal
The login combines the encryptedPassword with the keyId and the username to issue a request to Tableau Server. If successful, we need to capture the cookie from the response header and extract the workgroup_session_id and XSRF-TOKEN to use in any subsequent calls.
# Make sure to change your username
tableau_username = "Your Username"

def vizportalLogin(encryptedPassword, keyId):
     encodedPassword = binascii.b2a_hex(encryptedPassword)
     payload = "{\"method\":\"login\",\"params\":{\"username\":\"%s\", \"encryptedPassword\":\"%s\", \"keyId\":\"%s\"}}" % (tableau_username, encodedPassword,keyId)
     endpoint = "login"
     url = tab_server_url + "/vizportal/api/web/v1/"+endpoint
     headers = {
     'content-type': "application/json;charset=UTF-8",
     'accept': "application/json, text/plain, */*",
     'cache-control': "no-cache"
     }
     response = session.post(url, data=payload, headers=headers)
     return response

# Capture the response
login_response = vizportalLogin(encryptedPassword, pk)
# Parse the cookie
sc = login_response.headers["Set-Cookie"]
set_cookie = dict(item.split("=") for item in sc.split(";"))
xsrf_token, workgroup_session_id = set_cookie[" HttpOnly, XSRF-TOKEN"], set_cookie["workgroup_session_id"]
If you’ve made it this far you should be able to log in into Vizportal. Now comes for the fun part!
Using the Vizportal API: Update Extract Schedules
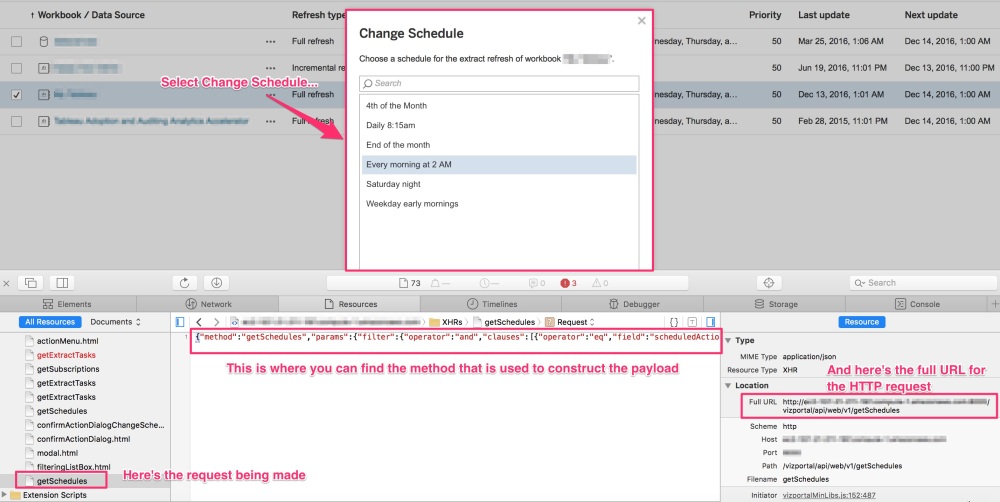
As I mentioned before, it’s currently not possible to change the Extract schedule associated with an Extract refresh using the REST API but it can be done with Vizportal. Before you try this, take a look again at the call being made in the browser. It will give you the format you’ll need to construct the payload for the HTTP request. I had to experiment with the formatting of the payload string to get it to match but once I did it worked perfectly.
# The task_id is the value from the "tasks" table in the Workgroup database
# that corresponds to the Extract associated with your Workgroup/Datasource
task_id = "55"
# The schedule_id is the value from the "_schedules" table in the Workgroup database
# for the schedule you want to change the task to use
schedule_id = "1"

# Use the xsrf_token you got from the login response cookie
def updateExtractSchedule(task_id, schedule_id, xsrf_token):
     payload = "{\"method\":\"setExtractTasksSchedule\",\"params\":{\"ids\":[\"%s\"], \"scheduleId\":\"%s\"}}" % (task_id, schedule_id)
     endpoint = "setExtractTasksSchedule"
     url = tab_server_url + "/vizportal/api/web/v1/"+endpoint
     headers = {
     'content-type': "application/json;charset=UTF-8",
     'accept': "application/json, text/plain, */*",
     'cache-control': "no-cache",
     'X-XSRF-TOKEN':xsrf_token
      }
     response = session.post(url, data=payload, headers=headers)
     print response.status_code
     return response
Success!
So Why Do This?
The current version of the REST API lacks some basic functionality that would be really useful to have. If you have a Server that doesn’t have a dedicated Administrator it can be hard to maintain the content and schedules as it grows. Automating these tasks can give your Tableau Server extra life and improve the experience for your users. I fully expect that more functionality will be added with each release and it’s only a matter of time before the REST API becomes fully featured. In the mean time, experiment with Vizportal and see what you can come up with.
Big thanks to Chris Toomey and Tamás Földi for all of their help in figuring this out.
One Year of Vizibly Diffrnt!
It was just this time last year that I returned home from #DATA15, inspired by all the great talks and people I met that I decided to start Vizibly Diffrnt. Even though it hasn’t been a very prolific first year (just 5 posts), I’ve really enjoyed connecting with the community and sharing my passion for all things Tableau. Most of the things I blog about have to do with Tableau Server but I’m on my way to #DATA16 in Austin hoping to change that.
Like every Tableau Conference, this one is chock-full of great sessions and I’m really hoping to dive deep into extending Tableau through the REST API and the newly announced Tableau & Python integration, TabPy. Knowing the community, I’m sure there will be some wild examples before the week is over. If you’re looking to share ideas or learn more about developing with Tableau, check out the Global Tableau Developers Group, all skill levels welcome.
Another goal I have for 2017 is to get back to my roots and spend some more time on Desktop. I recently posted my first Tableau Public Viz and for a follow-up I thought what better way to kick off Year #2 than with a recap of Vizibly Diffrnt’s 1st year.
If you’re on the way to #DATA16, just checking my blog for the first time or curious about the journey I invite you to take a look.
Want to connect at #DATA16, find me on Twitter @ViziblyDiffrnt!
Seize the Data,
Mark
My First Tableau Public Viz!
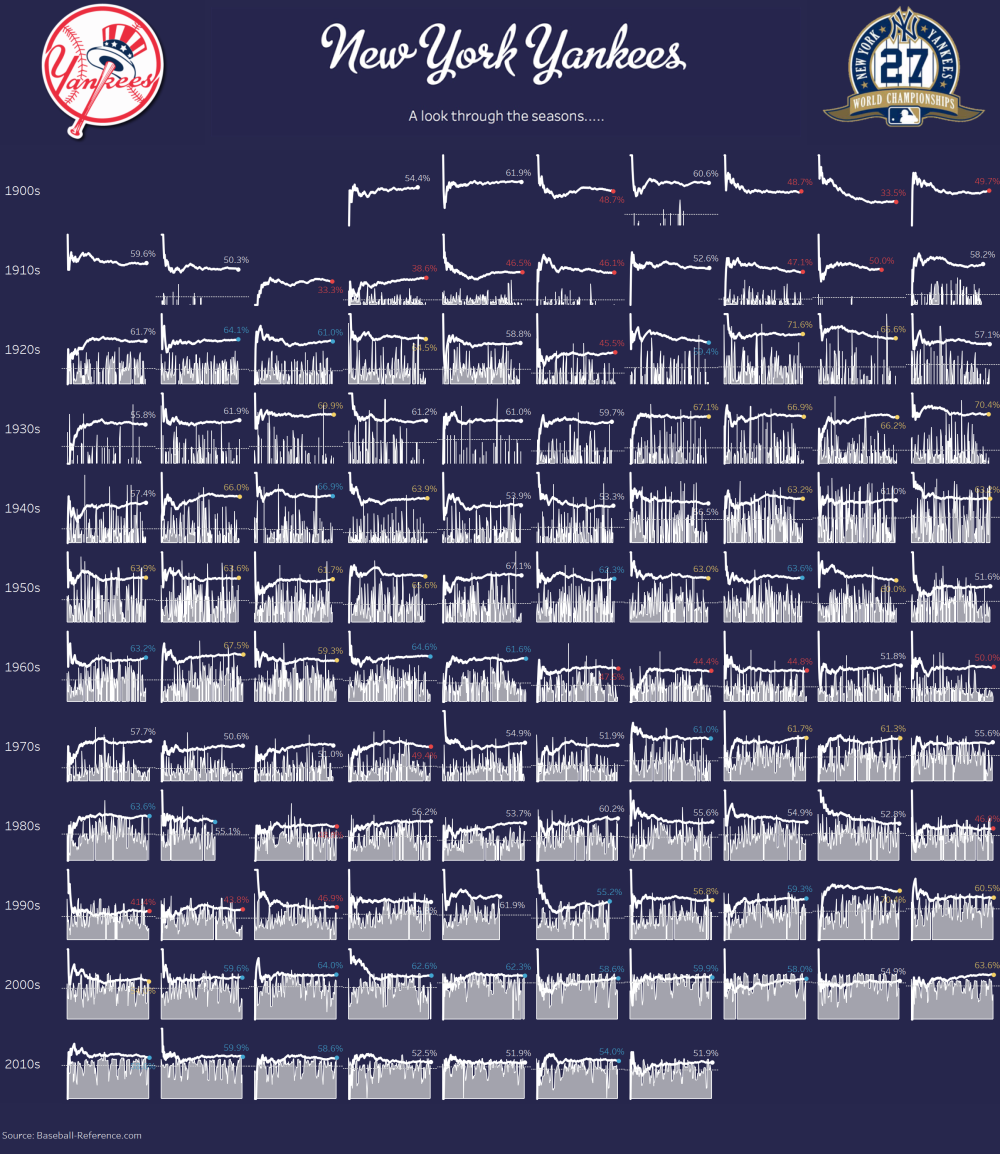
October is a great time of year. It’s full of age-old traditions like the changing of the color of leaves, the return of the Pumpkin Spice Latte (not a personal favorite but I bet a few of you know what I mean) and who can forget about Halloween. The one I look forward to every year is the Major League Baseball playoffs and it’s culmination in the World Series. Every season brings unforgettable memories and this year’s playoffs have been exciting as ever. Who knows, maybe this is the year the Cubs can finally win it all!
Unfortunately for me, my New York Yankees didn’t make the postseason and I’ll have to wait see if they can pull it off next year. So while I count down the days until Spring Training 2017, I thought I’d take a look back in history and reflect on their tradition of winning. If you’re a fan like me (or just love baseball and data), take a few minutes to soak in the nostalgia of 114 years of New York Yankees history.
Enjoy!

Choosing a Tableau Server Architecture
Depending on your organization’s needs, there are a variety of ways that you can configure Tableau Server. Choosing the right architecture for your server deployment is a crucial first step and can make all the difference in your users’ experience, and that of your administrator as well. So how do you know what configuration is right for you?
Single Node or Distributed Configuration
The decision to go with a Single Node installation or a Distributed (clustered) configuration should be based around a combination of the following details:
- Total User Count (the maximum number of licensed users)
- Concurrent Users (between 5 and 10% of your total user count should be a good enough estimate)
- Your License Strategy
- # of Extracts vs. Live Data Connections
- The amount of load you plan to drive (What Drives Tableau Server Load?)
- Availability expectations for your Tableau environment
So how many users do you have? Are you testing Tableau out with a select number of people in your organization or is your charter to grant access to everyone for ultimate transparency? In either case, there is a licensing strategy for all deployments and choosing the best one will also influence how you set up your configuration.
User-Based or Core Based License
User-based licensing is exactly what it sounds like. You purchase a license for every named user on your server. This is a common license strategy because most installations start out small and then grow organically. You may only have a small handful of users to begin with but this can quickly grow to 25, 50, 100+. For these environments, a single node running 8 cores with 32GB (the bare minimum) is generally sufficient and user-based licensing is perfectly suited.
But what happens when the entire company wants to get on the server? How can you add additional users when you have a limited amount of licenses? Wouldn’t it be great if you could automatically provision new users to a team that’s growing rapidly? That’s where core-based licensing comes in.
In contrast to user-based licensing, core-based licensing is based on the physical cores of your server’s hardware. You pay based on the processor cores of your hardware and the only limit to the number of users you can add is the level of performance you can consistenly deliver. With core-based licensing, you can onboard entire teams and quickly scale to meet your company’s demand. This license strategy assume a large volume of users and is most often associated with enterprise deployments.
Now that you’ve determined what licensing strategy is best for your deployment, it’s time to think about performance. As adoption increases, the volume of content on your server is going to grow and it’s quite common for there to be a perceived slow down in performance. Put simply, the demand for content (# of visualizations, extract refreshes, subscriptions being sent) has outgrown the original hardware specification and it’s time to upgrade.
So should you scale up or scale out?
Scaling Up
Scaling up means adding additional capacity within your current hardware. This could mean increasing the number of cores available to Tableau Server processes, adding more RAM to the system, swapping out hard disks for solid state drives or other improvements. Each of the above methods of scaling up comes with its own costs and some are greater than just the cost of the hardware. If you want to add additional cores to your server, you’ll need to upgrade your server license to leverage them and there’s a cost associated with that too. Scaling up can provide significant runway for your server and modern enterprise hardware can be upgraded several times. Eventually you’ll reach the limit of what a single machine can do. So what then? That’s where scaling out comes into play.
Scaling Out
Scaling out refers to adding additional capacity by increasing the total number of machines available to your Tableau Server configuration. Tableau Server supports a distributed or clustered configuration by letting you add additional machines to spread the load across them and thus increasing the overall capacity of your environment. As you can imagine, this can lead to some pretty complex configurations but for simplicity sake I’ll touch on just a couple of reasons why you might want to consider scaling out as an option:
Additional Capacity
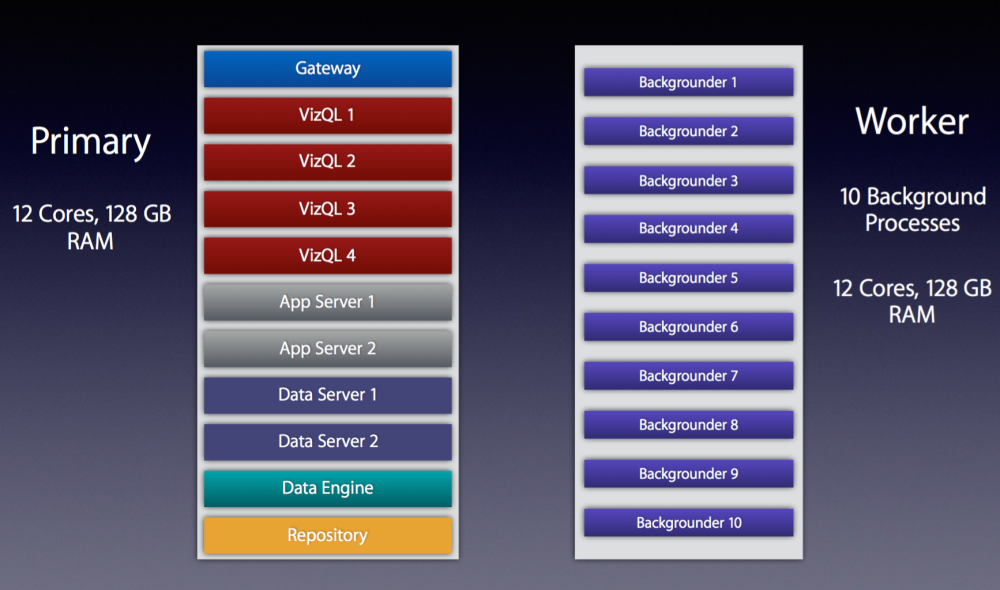
The most common reason I see for scaling out is to add additional capacity to Tableau Server. If you’ve maxed out your single node and performance is still not where you want it to be, adding a 2nd or 3rd node can provide the additional horsepower you need. Tableau Server does this through the power of Worker nodes. Worker nodes act in concert with the Primary node and can share the load of your Tableau environment.
There are several clustered configurations that you can adopt and the one you choose mostly depends on how your users interact with content on the server. If your server has a lot of extract refreshes being performed daily, consider using a dedicated worker node for background processing.
Tableau’s Backgrounder process is a primary driver of load on Tableau Server (see Paul Banoub’s excellent post on All About the Backgrounder for more detail) and offloading it to a separate machine can yield benefits including:
- Reduced strain on the VizQL process (which is responsible for rendering all those beautiful visualizations your team has built).
- Allocating more process threads to refreshing extracts, sending subscriptions, or executing commands via tabcmd. More process threads = more simultaneous jobs = less delay for content updates.
Example of a distributed system with a dedicated “Backgrounder” machine running 10 Background Processes
High Availability (HA)
High Availability is another major reason why I see organizations decide to scale out their servers. Tableau’s documentation does a great job of explaining what High Availability is so I won’t go into depth here but if you want to ensure that your Tableau Server is up even if one of your nodes goes down, you’re going to need a distributed architecture.
The best reason to scale out is if you want to build a high-performance, highly-available Tableau Server. These types of environments aren’t cheap but if you’re supporting thousands of users running thousands of extract refreshes around the clock it’ll give you the confidence to know that you can serve their needs.
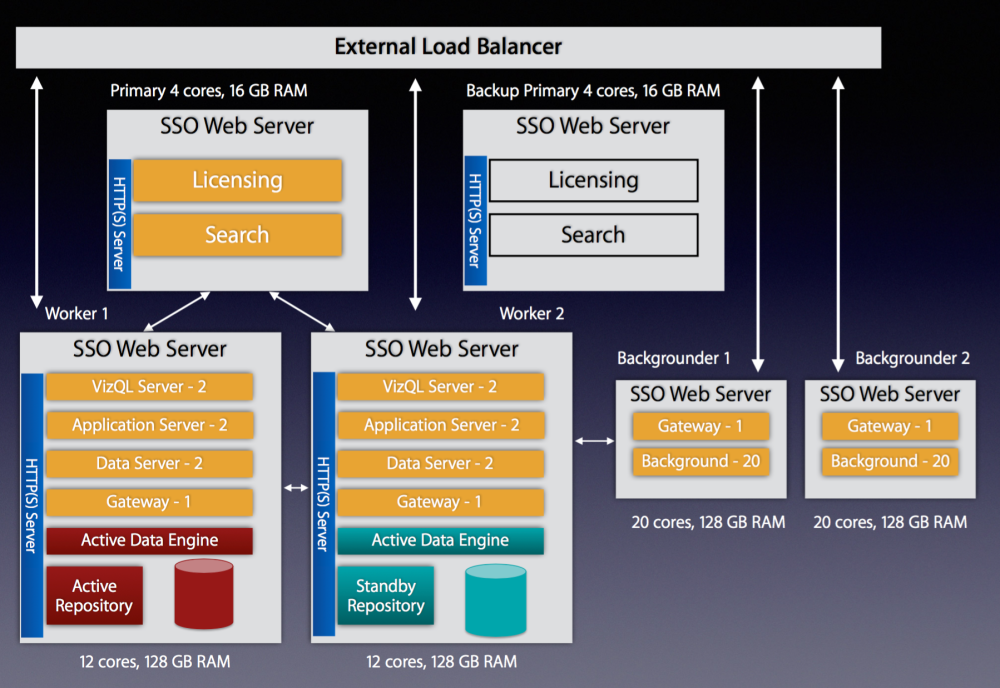
Highly available configuration with external load balancer, 1 Primary, 2 Worker Nodes, 2 Background Nodes, 1 Backup Primary: 64 total cores
Bare Metal or VMs
Now that you’ve chosen your configuration, it’s time to decide what kind of hardware you’re going to deploy it on. Will you deploy on Bare Metal or use Virtual Machines (VMs)?
The decision on whether to use physical hardware or go with virtual machines is a major one that should be thought through carefully. Virtual machines can be a great way to go as they take less time to procure and set up and are often cheaper than ordering custom hardware. A word to the wise though…if you go with VMs for Tableau Server there are some strict criteria that you’ll need your system adminstrators to guarantee or managing your server’s reliability will be a nightmare:
- Tableau’s minimum hardware requirements assume you are using bare metal physical servers, not virtual machines. The same is true for their scalability estimates.
- Because Tableau Server is a resource-intensive and latency-sensitive application, it requires dedicated resources. Pooling or sharing of CPU and RAM across other VMs on a host machine will lead to lots of issues with your configuration. Avoid pooling and sharing at all costs.
- Make sure you get 100% dedicated CPU allocation. Tableau’s minimum requirement for a Production environment is 8 physical cores. Tableau ignores hyperthreading so make sure when you ask for 8 cores you’re really getting the full amount.
- 100% dedication of RAM is important too. It cannot be dynamic RAM either. It should be contiguous on the host server and the minimum for a Production environment is 32GB. So if you’re running an HA setup with 3 machines you’ll need at least 96GB of dedicated RAM from a single VM host.
- The high-latency of Tableau Server also requires fast disk access. Don’t settle for network attached storage (NAS). Insist that you’re given a tiered SAN to get the highest level of write speed.
- If you’re running a distributed environment, you’ll want the latency between your workers to be less than 10ms. A poorly tuned VM setup will lead to poor server performance and you’ll feel like you wasted a lot of money on those extra cores you purchased.
- Do not use VM snapshots for backing up Tableau Server. The only supported method for backing up Tableau is to use the ‘tabadmin backup’ command.
- If your system admin is insisting on giving you a setup that has VMotion enabled, don’t use VMs. VMotion is a technology that allows VMs to move from one physical host to another for managing performance and it is not compatible with Tableau’s licensing technology. More about why this happens can be found here: VM server vs. Physical server.
- Keep in mind that the above applies to all machines running Tableau Server. If you’re using a clustered setup, make sure you get the same guarantees for the Worker nodes and the Primary.
Putting it All Together
By now you should have a good idea of what type of license you’re going to use, what your configuration will look like and whether or not you’re going to use physical hardware or go with a slate of dedicated VMs. Every installation of Tableau Server is unique to the business cases and environment it serves. I’d love to hear about your experiences with single vs. clustered setups and if you’ve had challenges with VMs over bare metal (or vice versa) so please leave your stories in the comments.
What Drives Tableau Server Load?
One of the most common challenges I see from clients using Tableau Server is around how they manage their server’s performance at scale. The story usually goes something like this:
- Initial Install of Tableau Server (low number of users, low utilization, fast server performance)
- Adoption grows (users increases moderately, utilization becomes more frequent, volume of content grows, fast performance maintained)
- Adoption continues to increase (users added daily/weekly, daily content interaction/creation, regular update of content on server, noticeable but manageable performance declines witnessed)
- Critical mass reached (100s to 1000s of users, constant content interaction, simultaneous updates of content occurring throughout the day, performance declines to a point where it impacts ability to conduct analysis)
Of course the desire is to never reach the point where the performance of your Tableau Server environment impacts the ability to do business, but it’s an unfortunate reality that you may have faced. So what do you do about it? To understand how to manage Tableau Server performance we first need to understand what drives it. For the remainder of this post we’ll refer to this as “load”.
What is “Load” and Why does it matter?
Load is defined as a measure of the amount of computational work that a computer system performs. It most commonly refers to CPU but can also refer to memory usage, network data transfer, and disk operations like I/O. We’ll focus on all of these as they are all impacted by Tableau Server’s application processes, albeit in varying degrees depending on the process.
What drives “Load” on Tableau Server
Under the hood of Tableau Server are several different application processes that combine to create the experience. You can learn more about them here but when we talk about what drives load we’re really talking about 3 processes:
- Backgrounder – executes server tasks, including extract refreshes, “Run Now” tasks, subscriptions, and tasks from tabcmd
- Data Engine (also known as the TDE Server) – Stores data extracts and answers queries
- VizQL Server – loads and renders views, computes and executes queries
Each of these processes is responsible for a key part of the Tableau Server experience and they frequently work in combination to accomplish the demands of users consuming, updating, and publishing content.The degree to which each process impacts your server’s performance will depend on your Tableau Server architecture. For example, if your server has a large number of extracts being refreshed concurrently, the Backgrounder process is going to affect performance more heavily than a server that favors live data connections. We won’t dig into architecture decisions in this post but how you design your server (single vs. multi-node, dedicated node for Backgrounder processes vs. mixed use, high-availability, etc.) is also a key consideration for how your server performs. For now, let’s dig into the 3 processes above to understand their impact on load in greater detail.
Backgrounder
The Backgrounder process is responsible for a large number of tasks but the most commonly used ones are extract refreshes, “Run Now” tasks, subscriptions, and any command initiated from the tabcmd utility. Any time you refresh an extract on the Tableau Server (manually or via a schedule), it’s the Backgrounder process at work. By design, the Backgrounder process is a single-threaded process and there can be multiple Backgrounder processes running at the same time. If you’ve ever seen the Tableau Server Maintenance page this will look familiar:
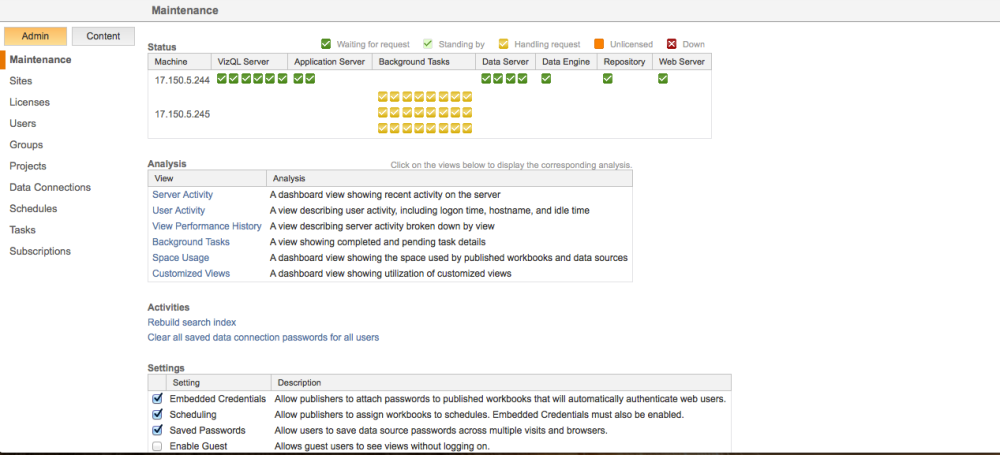
In this configuration, there are 2 nodes in the server cluster and one of them is dedicated to Backgrounder processing with a total of 24 Backgrounder processes. This allows the server to execute 24 simultaneous Background Tasks.
It’s important to note that single-threaded does not mean that multiple processes can’t run in parallel. What it refers to is that a CPU core cannot be logically split to share the workload, a process known as hyper-threading. Tableau Server does not currently support hyper-threading because each Backgrounder process has the ability to consume 100% of the CPU resources for a given core. Instead, multiple Backgrounder processes are used and the server runs one task per process, on separate cores.
Having said all of that, the Backgrounder processes primarily drives CPU, I/O and network resources. A large extract refresh could consume a lot of the network resources due the transfer of large data volumes and running several of these simultaneously can cause CPU on the server to spike. We’ll discuss how you track and manage this in a bit.
Data Engine
The Data Engine is what powers the data in your visualizations. The VizQL server, API server, data server, and background server processes all rely on the Data Engine to load the data into memory where it can then be queried at high speed. This is what allows Tableau Server to perform some operations faster when using extracts as opposed to live connections. As you’ve probably guessed, the Data Engine primarily drives load in regard to Memory usage but under high load it can consume CPU and I/O and lead to performance bottlenecks. If taxed too much, a single instance of the Data Engine can consume all CPU resources while it is processing requests resulting in slow performance for users interacting with content. It is common during an extract refresh that the Data Engine will be employed to write the data to its repository.
VizQL Server
The VizQL Server is the process that loads and renders views & computes and executes queries. This is rendering engine that takes your data and turns it into the visualizations that you’ve designed. Every time you load a workbook or make a filter selection, the VizQL process is querying the Data Engine and rendering the results. Load can only be associated with this process from browser-based interactions meaning that it’s driven by users performing tasks on the Tableau Server. The more users you have interacting with the server at a given time (concurrency), the higher the load is going to be on the VizQL process(es). Most often when users complain that it takes a long time to load a workbook, it’s the VizQL process that is experiencing heavy load. VizQL consumes CPU, I/O, or network resources and these processes can sometimes run out of memory.
How Do I Measure “Load” and What can I do about it?
Now that we understand what drives load, we need to measure it to understand where the constraints are. Tableau has released an open-source tool call TabMon that captures performance statistics on your server’s hardware and presents it via a set of Tableau workbooks so you can analyze it and make changes to your server’s configuration. There’s also a great series from Paul Banoub on How to Monitor Your Tableau Server. Below is an example of a visualization I’ve used to track the CPU, Memory and Disk load on my server’s hardware:
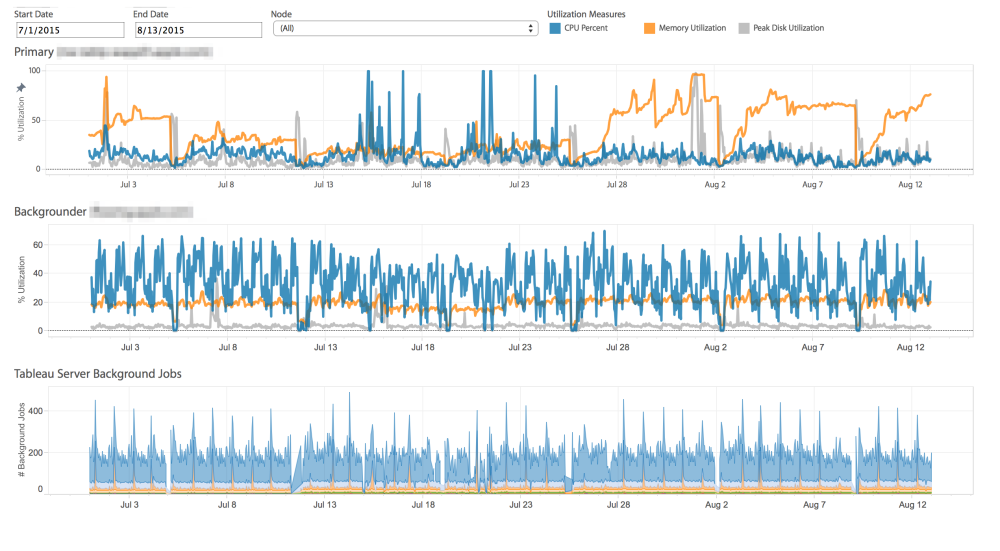 CPU, Memory, and Disk utilization at 1 hour increments
Depending on what you learn from the results, you might just need to add a couple of additional processes but if you’re really at capacity an architecture change could also be in the cards. Understanding how Tableau Server performs at scale is critical to providing your users with the best experience possible. Whatever insights you uncover, it’s best to review them in the context of what your users are doing. Talk to them and find out where they are experiencing issues when using Tableau Server and see if the data corroborates their stories. Develop a plan to address those topics and remember to capture the evidence from your server so you can see if the changes made a difference.
Features Coming in Tableau 10
I just returned from an amazing week at Tableau’s annual conference in Las Vegas and I’m incredibly excited about the new features shown during the keynote. Presented by the developers themselves, Tableau showed off a slew of game-changing enhancements that will likely make their debut in the next major release, Tableau 10.
Here are a few of the features that will be part of Tableau 10 (if not sooner):
Tableau Desktop
- Total Control – Most notably the ability to prevent Grand Totals from affecting color palettes. Long overdue but very welcome.
- Data Highlighter – Using the power of search to highlight points of interest.
- Global Post Codes, Custom Territories, & Spatial Data
- Mapbox Integration (coming in 9.2) – This is exciting. Now you can integrate new maps & map layers from Mapbox including topographical maps and drive time information.
- Viz within a Viz! – This drew a standing ovation from the crowd at the keynote when it was demoed. Being able to embed a Viz within in tooltip is going to change the way people design in Tableau. Expect some really cool uses of this once the community gets their hands on it.
- Cross Database Joins & Filtering
- Union of Data Sources
- Advanced Date Recognition (9.2)
- Advanced Analytics (Outlier Detection, native K-means Clustering) – Bringing the power of tools like R natively into Tableau will reduce the learning curve for many users that want to run advance statistical analysis on their data. I expect this is just the tip of the iceberg for what will come in the future. Maybe predictive analytics someday?
- Device Specific Dashboards – A clever new feature. You’ll be able to create different layouts of a single dashboard that render differently depending on the device being used. This is a must have for mobile adoption but I’m wondering if something will be lost in translation.
Tableau Server
- Version Control – Ever overwrite a published workbook by mistake? With version control you’ll be able to easily restore that old copy with just a couple of clicks.
- Content Analytics (Sparklines and Bars) – This one caught me by surprise. Tableau has come up with a simple, elegant way of surfacing some high level usage stats on content. Incredibly useful and unobtrusive.
- Search Improvements
- Tableau Server Manager – A dedicated web app for admins to make server configuration changes.
- Lock Project Permissions
- Full-Feature Web Authoring
Of all the features shown during the keynote, the ones with the biggest potential to change how we see and understand data with Tableau are going to be the Cross Database Joins and Filtering. Today many of us use parameters to get around the limitations of quick filters on dashboards but with cross database filtering that won’t be as big of a need anymore. I’m most excited about the cross database joins. Connecting to Live DB and Excel in a single datasource?! Goodbye data blending!
What were you’re favorite features mentioned during the keynote? Did I leave anything out?
Inside Tableau Server: Exploring the Background Jobs Table
This post originally appeared as a guest post on The Vizioneer.
If you’ve ever tapped into the Postgres DB that lies at the heart of Tableau Server, you’ll find that it is a gold-mine of data about how your users interact with and experience your Tableau Server. Statistics on everything from how frequently users access workbooks, when they publish content and how well your server is performing can be gleaned from this data. And what better way to do that than by hooking up Tableau directly to get these insights.
Lots of posts have been written about how to access these tables and Tableau has published a data dictionary about what you’ll find within. There have also been numerous contributions from the Tableau Community showing what can be done with this data. Jeffrey Shaffer, who runs the amazing Tableau Blog data + science, has compiled a list of these on his Tableau Reference Guide.
Much of my client work is focused on helping organizations understand what’s going on inside their Tableau Server platforms. On a recent assignment, I had the challenge of needing to understand what was causing my client’s Extract Refresh jobs to experience long delays. I knew that by tapping into the background_jobs table I’d be able to find my answer.

To see where the delays were, I created a heat map detailing the delays between the scheduled start time and the actual start time of each job. This showed me where the bottlenecks were but one piece was still eluding me. Specifically, I needed to connect the performance of each refresh job back to the workbook or datasource that was experiencing the delay and then to the project where it was located.
Looking for a Solution
At first this would seem like an easy task. I would just join the background_jobs table back to the workbooks table or datasources table on a common ID field and go on with my analysis. That was until I looked at the contents of these tables. The background jobs table does not contain a workbook_id or datasource_id like the other tables within the workgroup schema.
It does contain a “title” field which has the name value of the content and a “subtitle” field that displays either “Workbook” or “Datasource” if the background job is related to an Extract refresh but this is not unique.
What happens if you have a workbook in 2 different projects with the same name? How would you know you were getting the job results of the right workbook? This was indeed my problem so I began to look for a more unique way to link these tables. After all, Tableau Server has to be able to make this association so it can perform the desired operation, right?

Discovering the Link
I knew the answer had to be within the background_jobs table, so I went digging. Low and behold, I found my answer within the “args” field. For a Workbook’s Extract Refresh job, the “args” value looks something like this: Read More
Welcome to Vizibly Diffrnt!
Welcome to Vizibly Diffrnt, a blog about data visualization. My name is Mark Jacobson and while I’m new to the blogging world, I’m no stranger to data and the wondrous things you can do with it. My journey with data first started 10 years ago but it wasn’t until I discovered Tableau in 2013 that my opinion of what business intelligence should be was forever altered. For me, Tableau unleashed a way to deliver insights to my colleagues through the power of interactive, colorful and dynamic tools that made all other methods obsolete. Gone were the endless grids of data that users would have to pour over for hours to glean the smallest of insights. What lay before me was a canvas of endless options for me to tell stories with data, an opportunity to be…vizibly diffrnt!
This blog will focus on telling stories with data, data visualization best practices, tips and tricks to help you through the challenges of creating powerful dashboards, and how to scale your server environments to deliver the best Tableau experiences for your audience.
Data to the people,
Mark
